
Here is the graph that I had been do in Economic.
air jordan Cheap
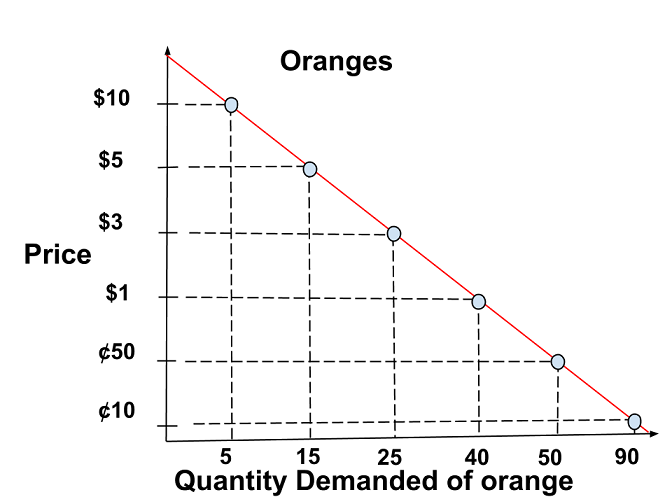
The graph show when the price o orange is increase so the quantity demand of orange is decrease, but if the price of the orange is decrease so the quantity demand of orange is increase.
air max 360
Second graph
Here is the other graph that I did after I make the first graph.
nike air max 90

nike air max cheap
The graph show the supply is increase. One shifter that make supply increase is price of resource because the electricity of the factory is going down so the seller want their price to go up to get more benefit. The first equilibrium and new equilibrium $10 and the quantity is 100. The new equilibrium price shows the price decrease and the quantity is increase.
ebay ray ban sunglasses